In the minds of ESL exam candidates, e ssay writing is one of the most daunting tasks they are required to complete, regardless of the level of the exam, the administering body or the ease with which they themselves use the language. The same applies to students who are asked to write an essay by their teachers at school. In the previous sample essays posted on the blog, the main point I stress is the need to become acquainted with this form of writing (as opposed to writing a letter, review or report, for instance), to get a feel of what authorial voice is and how to organize and progressively express the arguments you wish to make in a coherent manner. Unfortunately, the best way to prepare for exam writing or learn how to write good essays for school is to read as many essays from as many sources as possible, then write as
This, I hope, is the first of several sample reports to come. They follow the guidelines for the IELTS Task 1 writing section which asks candidates to write a summary of data presented in a graph or diagram.
Task 1 can therefore be seen as consisting of two subcategories of tasks:
In this series of reports, I'll focus on the first type which deals with graphs so that candidates can see how facts can be grouped together and presented in an orderly manner.
You can begin by reading my post
especially taking note of point number 3 towards the end.
Let's turn to the table at hand. It's a rather longish 280-word report, the point being to give more variety for candidates so they can underline and add to their list of phrases to use.
Task 1 can therefore be seen as consisting of two subcategories of tasks:
- a graph, chart, table or
- a diagram, map, image showing a process or object
In this series of reports, I'll focus on the first type which deals with graphs so that candidates can see how facts can be grouped together and presented in an orderly manner.
You can begin by reading my post
especially taking note of point number 3 towards the end.
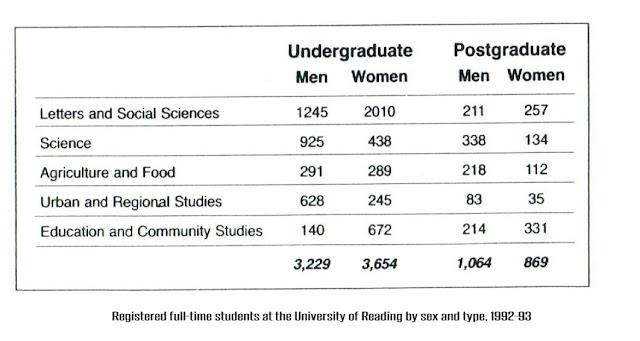
Let's turn to the table at hand. It's a rather longish 280-word report, the point being to give more variety for candidates so they can underline and add to their list of phrases to use.
The
table shows the number of men and women enrolled in five different fields as
full-time undergraduate and postgraduate students at the University of Reading
for the 1992-1993 academic year. What is evident from this table is that
numbers vary according to gender and type of studies to such an extent that a
uniform trend cannot be noted.
One area where student registration
differs is in the number of male and female students. Though more women undertake
undergraduate studies, the opposite can be said of postgraduate students. The
difference between undergraduate men and women is in fact twice that of
postgraduate students in that slightly over 400 more women attend undergraduate
courses while only 205 more men do so at a postgraduate level. In total, 3654
women are undergraduate students in contrast to 3229 men, while at postgraduate
level 1064 men outnumber the 869 women who decided to continue studies.
Another gap between under and postgraduate students concerns the studies
they choose to undertake. The most popular courses at undergraduate level are
those in Letters and Social Sciences with well over 3200 students. However, at
postgraduate level, this field ranks third after Education and Community Studies
with 545 students and Science with 472. Science in fact is the only discipline
that steadily ranks second at undergraduate and postgraduate level. Finally,
the least popular courses with under 1000 students overall across the board are
Agriculture and Food as well as Urban and Regional Studies, something which
marks a striking contrast when total student enrollment on the three other
disciplines ranges from 1357 in Education and Community Studies, 1835 in
Science and 3723 in Letters and Social Sciences.
Need help with the IELTS Speaking? Click on the image below.
For IELTS essays (Task 2) click here:


