
In the minds of ESL exam candidates, e ssay writing is one of the most daunting tasks they are required to complete, regardless of the level of the exam, the administering body or the ease with which they themselves use the language. The same applies to students who are asked to write an essay by their teachers at school. In the previous sample essays posted on the blog, the main point I stress is the need to become acquainted with this form of writing (as opposed to writing a letter, review or report, for instance), to get a feel of what authorial voice is and how to organize and progressively express the arguments you wish to make in a coherent manner. Unfortunately, the best way to prepare for exam writing or learn how to write good essays for school is to read as many essays from as many sources as possible, then write as
IELTS Academic Task 1 Sample Report 3 (Air Pollution: Emissions of black smoke, sulphur dioxide and nitrogen oxides)

The graph in this case deals with three categories of gas emissions that contribute to air pollution. It is a longer report than what a candidate would have time to draft (230 words approximately), but the reason for this is to give candidates more words to underline and add to their list of phrases to use in such types of writing tasks.
You can begin by reading my post

especially taking note of point number 3 towards the end.
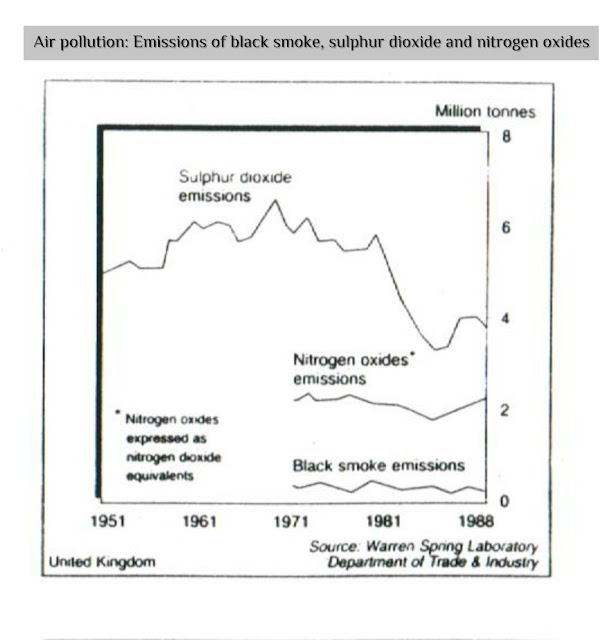
According
to the Warren Spring Laboratory Department of Trade & Industry, in the
United Kingdom between 1951 and 1988 gas emissions linked to air pollution present
an overall relatively uniform trend. The three types of gases studied over the
37-year period were sulphur dioxide, nitrogen oxides and black smoke.
Specific figures for the two latter categories
of gases first appear on the line graph in 1971, with nitrogen dioxide and equivalent
gases fluctuating slightly over or under 2 million tonnes from the beginning of
the 70s until 1988. Meanwhile, black smoke emissions consistently rise and fall
at around 100 thousand to 150 thousand tonnes.
However, the highest pollutant in terms of
tonnes emitted into the atmosphere is sulphur dioxide. In 1951 close to five
million tonnes were released into the air and after an erratic rise with sudden
surges around 1956 and again close to 1966, a peak was reached in 1970 at approximately 6.5 million tonnes. Most
noteworthy, also, is the sudden decline in emissions which began in 1980 at
under 6 million tonnes that continued until emissions fell to the lowest point
in the mid-1980s at slightly over 3 million tonnes.
Overall, a consistent two-million-tonne difference
between the three categories of gases is maintained, though from 1971 to the
mid-1980s, sulphur dioxide emissions were three and almost six times higher
that nitrogen oxides and black smoke emissions respectively.
Find other IELTS Task 1 reports here:

Need help with the IELTS Speaking? Click on the image below.

For IELTS essays (Task 2) click here:
